Retirement Savings Calculator
A Calculator for Retirement Savings in Google Sheets
The Retirement Savings Calculator Spreadsheet is a tool designed to help individuals calculate how much they can save and accumulate based on different levels of savings and expenditures. As of 20 March 2023, the latest version of the tool is v2.4, and is publicly available here.
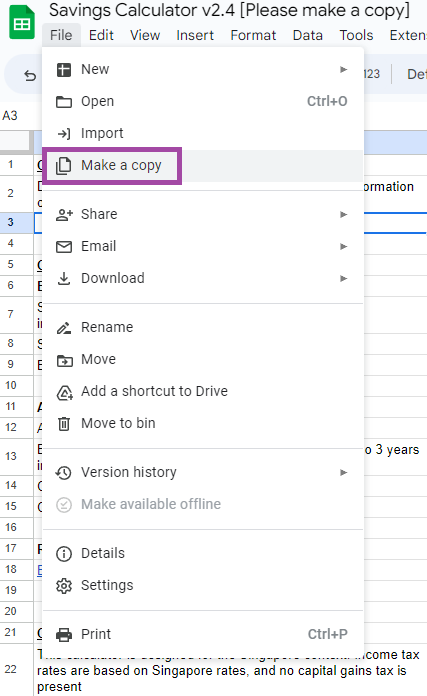
Do make your own copy for yourself via “File” > “Make a copy”.
Do share your feedback on the calculator via the feedback form.
Contents
- Contents
- Objective
- Why Google Sheets?
- Getting your copy of the Savings Calculator
- How does it work?
- The Plan tab
- Keying in your parameters
- Parameters
- The Charts
- Assumptions
- Conclusion
Objective
The objective of this retirement savings spreadsheet is to provide individuals in Singapore with a simple and locally relevant tool to calculate how much they need to save for retirement based on their expected expenditures and income. This spreadsheet takes into account Singapore’s specific income tax and pension (CPF) values to provide more locally relevant estimates. By using this tool, I hope that you can gain a better understanding of your retirement savings needs and make informed decisions about your financial future.
Why Google Sheets?
The Savings Calculator Spreadsheet was created using Google Sheets as the tool of choice. One maing reason was that it would be free for me to develop, free for me to distribute, and free for users to use. Additionally, using Google Sheets instead of a web application and database ensures that the user’s data is kept under their control, without giving me or a third party access to any of it. This is an essential feature as people would be keying in their own financial information to do their planning.
As a security consideration, I have also chosen not to use any scripts in the calculator. I wouldn’t feel safe enabling scripts on a spreadsheet from some guy on the internet before keying in financial data, and neither should you.
Getting your copy of the Savings Calculator
Once you have opened the public copy of the Savings Calculator, go to “File” > “Make a copy” to make a copy for yourself. The public copy is not editable, to prevent users from making their personal financial information public.
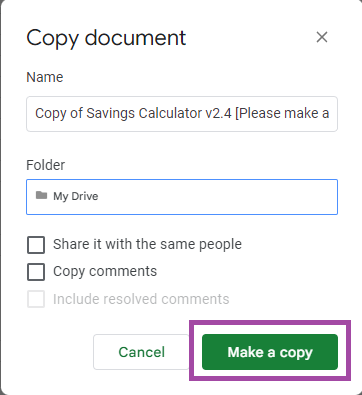
Select a folder to save your own copy in, and press “Make a copy”
How does it work?
The Savings Calculator calculates the portfolio/savings value of the person or couple over time. This is based on the following sequence of events
- Savings starts from the year Start Saving in Year
- Each year before retirement, the portfolio grows based on returns as well as contributions to savings.
- After retirement, salaried income, portfolio contributions, and pre-retirement expenses stop, and portfolio withdrawals to fund retirement income commence.
- If CPF is enabled, CPF Life Payouts will start at the CPF LIFE payout age. This will reduce the amount that is withdrawn from the portfolio to support retirement
- At each person’s death age, they will stop withdrawing their share of expenses.
Note that three years of retirement expenses (adjusted for inflation) are held as cash. In case of an economic downturn, this pool of cash aims to reduce the need to sell assets from your portfolio during a downturn.
The Plan tab
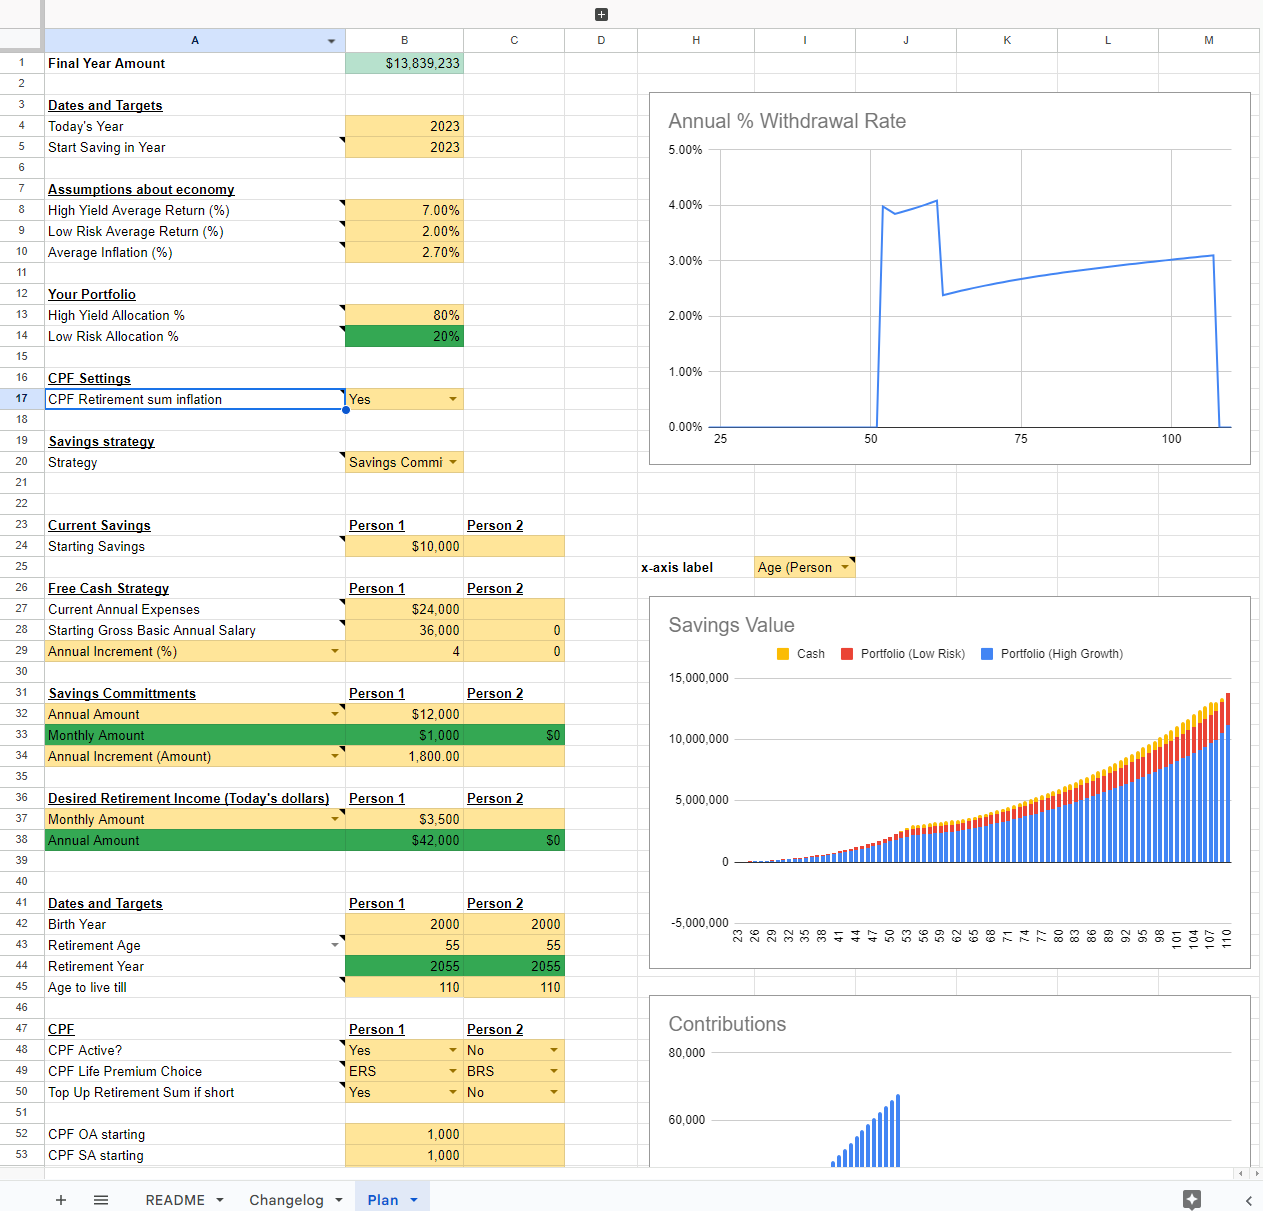
The Plan tab is where the action happens. You can key in your desired parameters on the left, and the Savings Calculator will estimate how your savings will look like over time, as visualised by the charts on the right.
Keying in your parameters
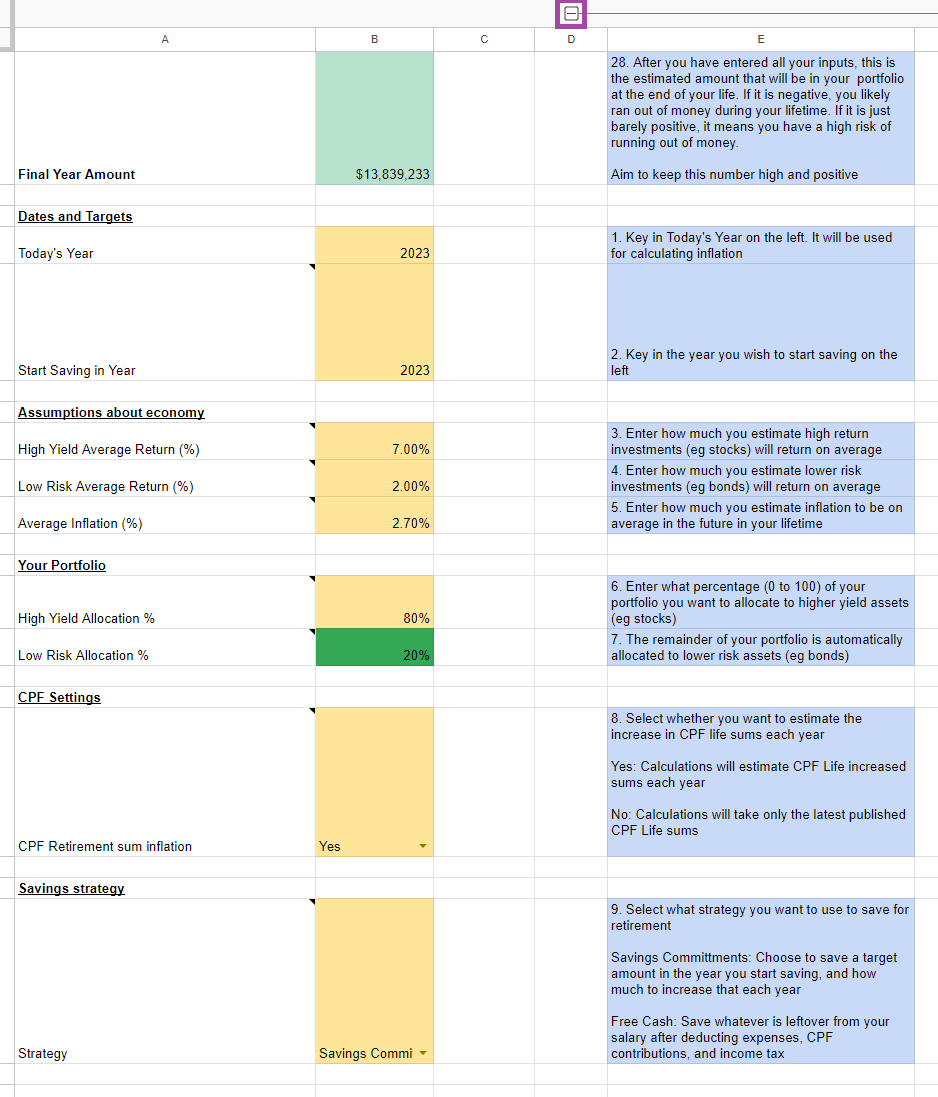
The savings calculator does require a number of parameters to help estimate your savings over time. The blue boxes in the spreadsheet will guide you what inputs to key in at each step.
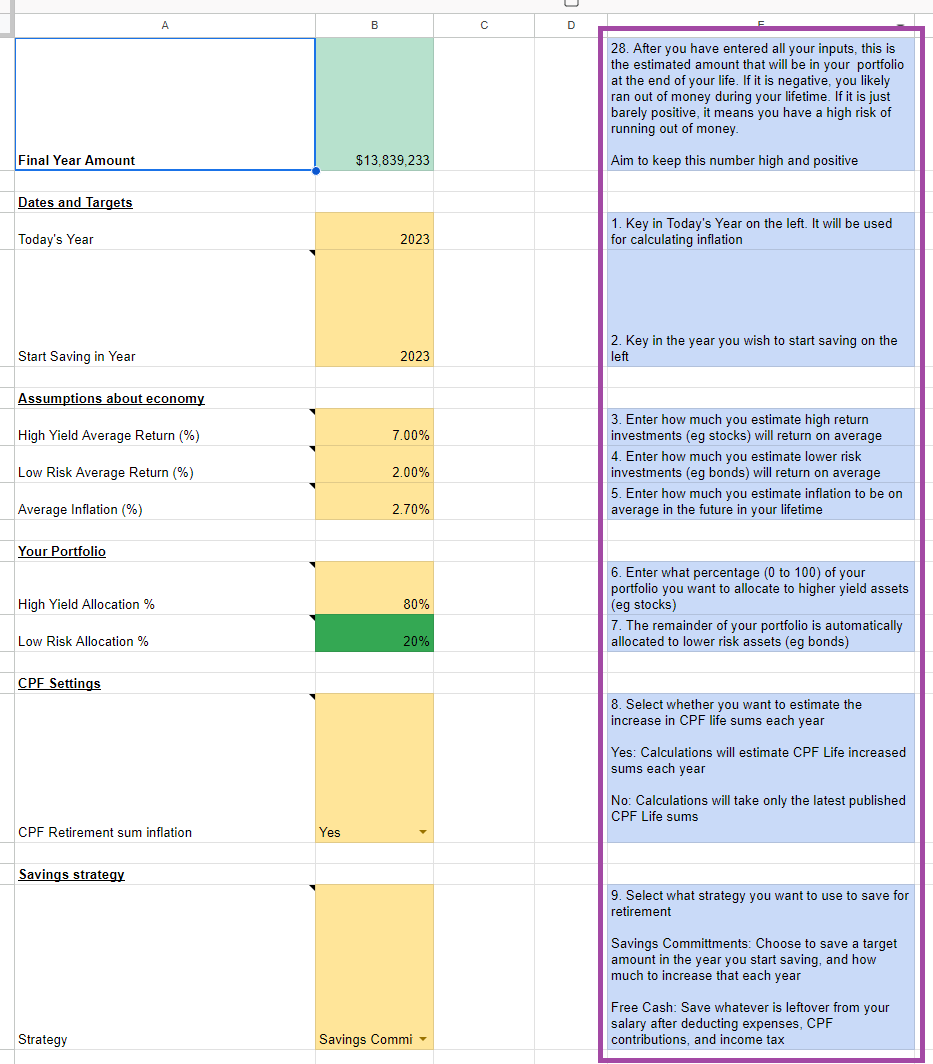
Some parameters do have fields for two people. If you are planning solo, you can leave the second field blank or at zero.
Parameters
Dates and Targets
- Today’s Year: Today’s Year tells the calculator what year it is currently, so that it can correctly apply inflation to future years to compute your needed expenditures
- Start Saving in Year: Some people might be planning their savings in advance. You can key in a year equal to or later than Today’s Year into this field to reflect that. This will tell the calculator what year your savings plan will commence.
Assumptions about economy
- High Yield Average Return: Most people’s portfolio contain High Yield assets (eg Stocks, Equity ETFs). Key in the average annual return you expect from such assets in percentage points.
- Low Risk Average Return: Most people’s portfolio contain Low Risk assets (eg Bonds, T-Bills). Key in the average annual return you expect from such assets in percentage points.
- Average Inflation: The cost of stuff goes up over time. Key in how many percent points the stuff you buy is expected to go up each year.
Your Portfolio
- High Yield Allocation Percentage: Key in what percentage of your portfolio is in High Yield assets (eg Stocks, Equity ETFs). The remaining percentage of your portfolio is assumed to be in Low Risk assets, and automatically computed.
CPF Settings
- CPF Retirement sum inflation: This toggles whether the calculator will assume that CPF Retirement sums will continue to increase at a similar rate as they have in the past. Historically, CPF retirement sums have increase about 2.5-3.5% per year.
Savings strategy
- Strategy: This selects which Savings Strategy the calculator will compute your future savings on
- Savings Committment: In this strategy, you will save a target amount of savings every year or month, and increase that every year by a certain percentage or flat amount.
- Free Cash: Instead of fixed targets, you will save whatever is left over from your gross salary after deducting the following
- income tax
- employee CPF contributions
- expenses
If you prefer to plan your finances around “I will save this amount from my salary every year, and spend the rest”, go for the Savings Committment. If you plan via “I will spend this much of my income and save the rest”, go for Free Cash.
Current Savings
- Starting Savings: Key in the dollar value of the savings that you currently have
Free Cash Strategy
If you selected Free Cash as your Savings Strategy earlier, here is where you would key in the parameters for the strategy.
- Current Annual Expenses: This represents how much your expenses are each year in today’s dollars. It will be adjusted for inflation to estimate how much your expenses will be from now until retirement
- Starting Gross Basic Annual Salary: This represents how much your gross annual salary is, before deductions like income tax and employee CPF contributions.
- Annual increment: Key in how much you expect your annual salary to increase by each year, either in percentage points, or dollar amounts.
Savings Committments
If you selected Savings Committments as your Savings Strategy earlier, here is where you would key in the parameters for the strategy.
- Annual Amount / Monthly Amount: Select whether you would like to specify your savings committments monthly or annually, and key in that number. Whichever you select, the other will be computed and displayed for you in the following row
- Annual Increment: Select whether you would like to key in your annual increment in percentage or dollar amounts, and key in that number
Desired Retirement Income (Today’s dollars)
- Annual Amount / Monthly Amount: Select whether you would like to specify your retirement income monthly or annually, and key in that number. Whichever you select, the other will be computed and displayed for you in the following row. You don’t need to key in an increment number here. That will be computed based on the inflation number you entered earlier.
Dates and Targets
- Birth Year: Enter the Birth year for each person. This is used to compute CPF Life start date if enabled, or retirement year if you enter a retirement age.
- Retirement Age/Year: Select whether you wish to enter a retirement age or retirement year, and key in that value. Whichever you select, the other will be computed and displayed for you in the following row.
- Age to live till: Enter an age that your retirement savings need to support you until.
CPF
- CPF Active?: Key in Yes or No, depending on whether CPF is active for you. Note that Singapore Citizens and Permanent Residents have CPF active, with no choice in the matter.
- CPF Life Premium Choice: CPF Life has several choices of premiums. In increasing order, the options are the Basic Retirement Sum (BRS), Full Retirement Sum (FRS), and Enhanced Retirement Sum (ERS). The larger the premium paid to CPF Life, the larger each of the monthly lifeling payouts will be.
- Top Up Retirement Sum if short: Select Yes if you want to top up your CPF Life Premium up to your selected Retirement Sum amount if your CPF account has less than the desired sum at age 55. Required funds will be withdrawn from your portfolio and transferred to your CPF.
- CPF OA starting: Enter the current starting amount of funds in your CPF OA account.
- CPF SA starting: Enter the current starting amount of funds in your CPF SA account.
- CPF MA starting: Enter the current starting amount of funds in your CPF MA account.
- CPF RA starting: Enter the current starting amount of funds in your CPF RA account.
- Annual CPF OA drain: Enter any routine expenses paid for by your CPF OA (eg housing loan).
- Annual CPF MA drain: Enter any routine expenses paid for by your CPF MA (eg routine medical treatment).
- CPF OA drain end year: Enter the year your routine CPF OA expenses are expected to end (eg housing loan end date).
- CPF MA drain end year: Enter the year your routine CPF OA expenses are expected to end (eg treatment completion date).
After keying in all the parameters, if you do not need to instruction guide boxes in blue, do close them by clicking on the “-“ sign above column D. This will reduce screen space needed.
The Charts
The charts help to visualise how our plan plays out over time, based on the parameters we put in.
Annual % Withdrawal Rate Chart
On the top right, the chart displaying the annual percentage withdrawal rate over time is shown.
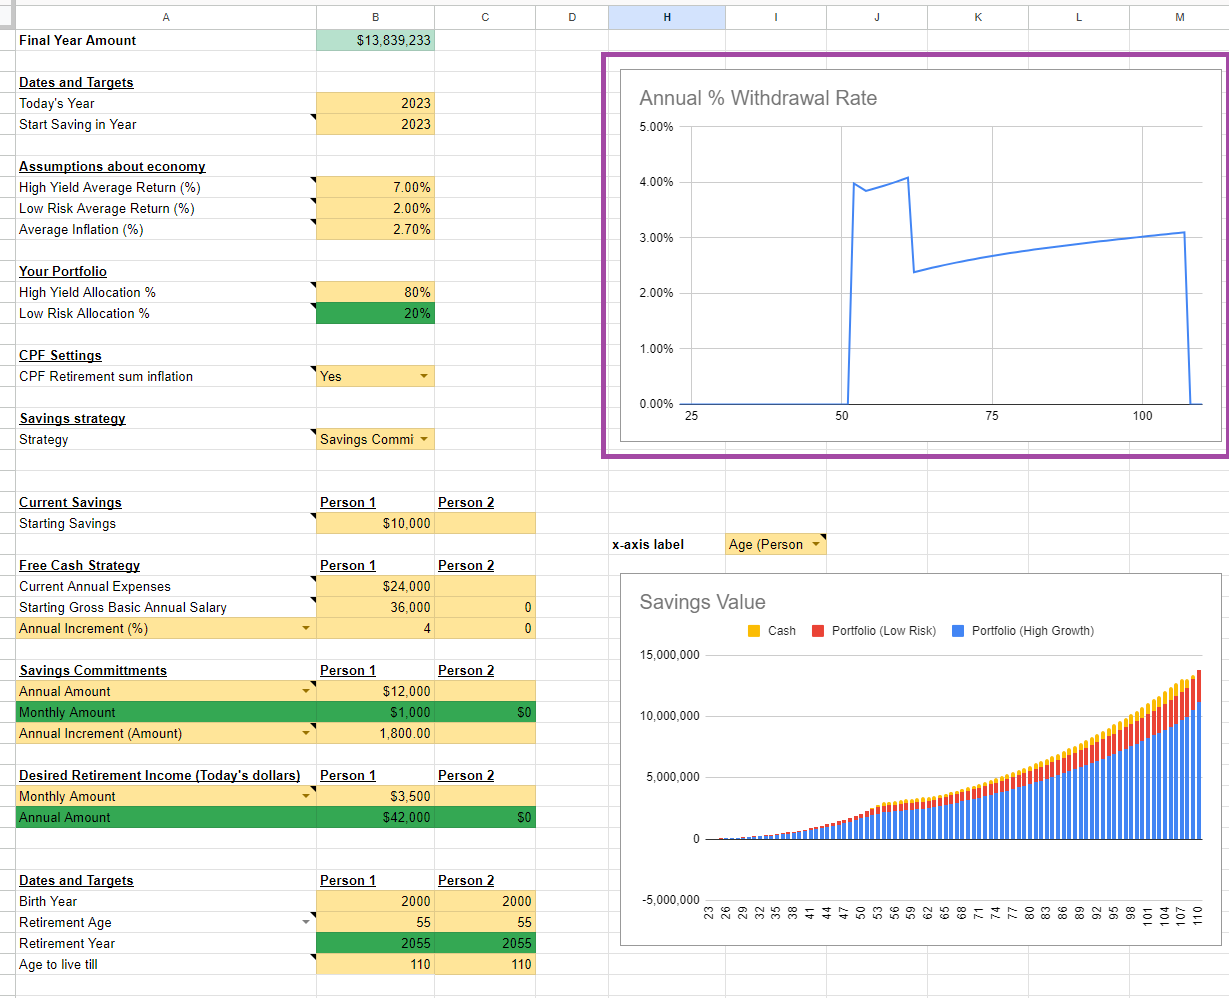
This chart shows what percentage of our portfolio we are withdrawing each year. This is one of the main charts I look at to assess how comfortable I am with the amount of savings entered into the plan.
In the chart above, we have a fairly comfortable amount of savings, with withdrawal rates gradually increasing from around 2.5% to 3% over the course of retirement. The initial temporary spike is when we are withdrawing exclusively from the portfolio before CPF life kicks in. With CPF Life paying out, we need to withdraw less from our portfolio, and have a lower withdrawal rate.
If we don’t have sufficient savings to support our retirement income, the chart will trend upwards towards 100% or more, then drop to negative once the portfolio is depleted. In less drastic situations, the withdrawal rate might creep up over time to uncomfortable levels (eg 50%). These situations are undesirable, as they signal a high chance of running out of retirement savings, either with or without a market downturn.
There are different schools of though around how to manage withdrawal rates over one’s lifetime. Some feel it’s appropriate to deplete your savings just before you die, and so 50-100% withdrawal rate in your final year is acceptable. Others prefer to be able to keep their withdrawal rates below 4%. Selecting an acceptable withdrawl rate is a whole topic in and of itself, and we won’t delve into it here.
To lower withdrwal rates and increase the chances of our retirement savings lasting through retirement, there are several options
- Savings Strategy independent
- Retire later
- Lower retirement income
- Free Cash Strategy
- Increase your salary
- Increase your salary increment
- Reduce your pre-retirement expenses
- Savings Committment Strategy
- Increase the amount you save each month or year
- Increase your savings increment
On the flip side, it’s possible that you might find that you have a withdrawal rate that is very low (less than 2%) and getting lower over time. This suggests that your savings are growing at a rate faster than your inflation-adjusted retirement income consumes. This suggests that you have some financial leeway that you can make use of. Essentially, you have the liberty of experimenting with doing the opposite of what we outlined previously.
- Savings Strategy independent
- Retire earlier
- Increase retirement income
- Free Cash Strategy
- Have a lower salary
- Have a lower salary increment
- Increase your pre-retirement your expenses
- Savings Committment Strategy
- Reduce the amount you save each month or year
- Reduce your savings increment
Savings Value Chart
Next we have a chart that shows how much is in our savings portfolio each year, broken down into Cash (our 3 year buffer), Low Risk Assets, and High Risk Assets.
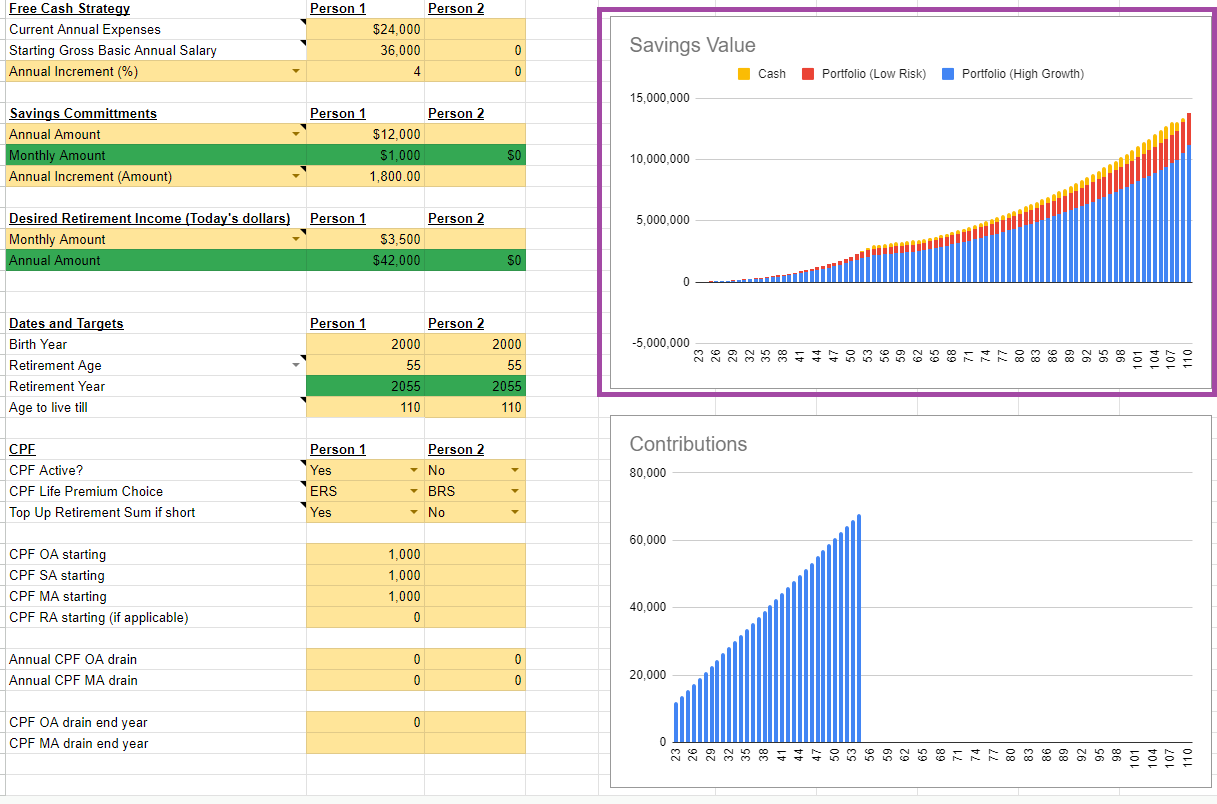
Do note that the numbers are not inflation adjusted (ie they are nominal).
Usually, we expect to see the chart trending upwards as it keeps up with inflation over time. If the chart goes flat or trends down, there’s a risk that our portfolio isn’t growing enough to outpace inflation, and we might be at a higher risk of running out of funds. This visual is less sensitive to diagnosing overall sustainability than the Withdrawal Rate chart, so definitely don’t skip over that.
Contributions
Finally, we have a chart that shows how much we contribute to our retirement savings each year.
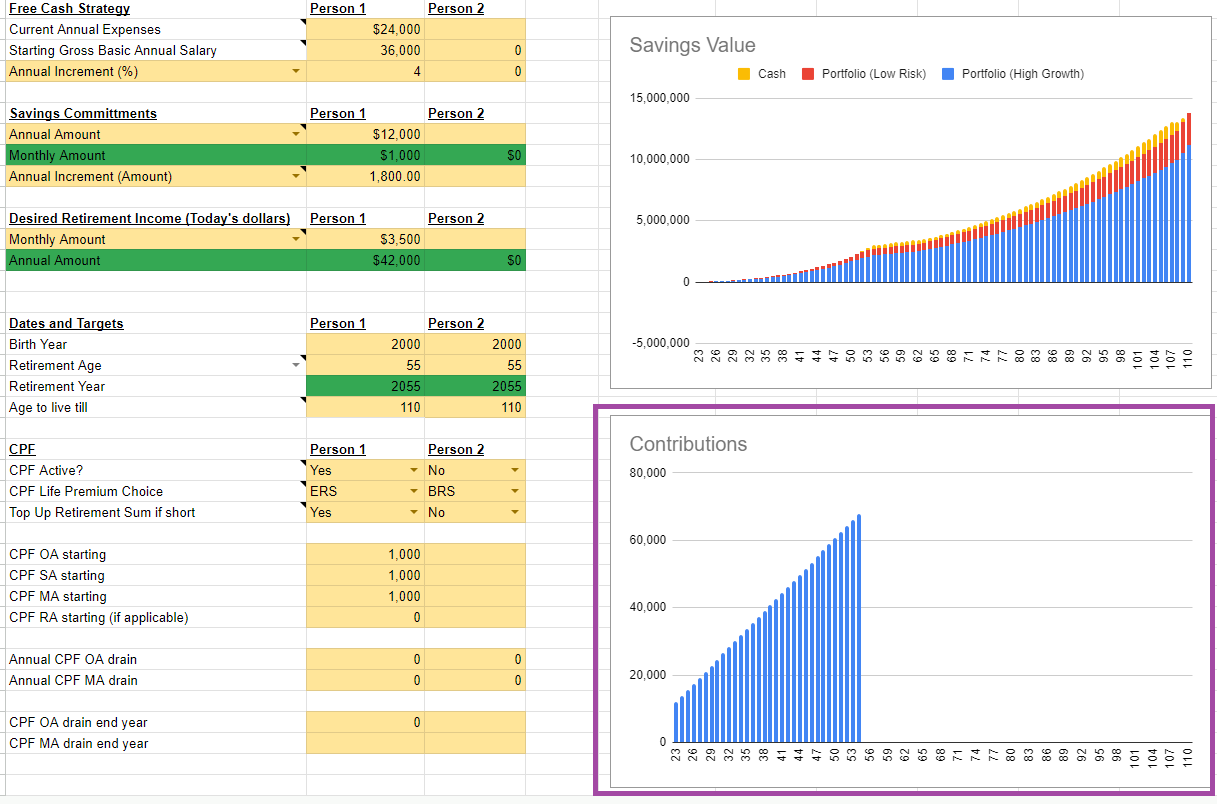
This chart is useful if you are planning for two people, and you might retire at different times. It will give a sense of how the savings contributions evolve over time.
Assumptions
Income tax rates and no capital gains tax
This calculator is tailored for the Singapore context, so Singapore personal income tax rates are used for the income tax calculation in the Free Cash Strategy.
Singapore also has no capital gains tax, so these are not factored in to the calculator.
Return Rates of assets
The calculator accepts any return rates for assets that you key in. It has no ability to assess what rates are feasible or possible. Do seek formal financial guidance in this area for advice that is specific and suitable to you.
Rate of return is average and constant
The calculator has no ability to predict or simulate market downturns and fluctuations. It will only increment your portfolio by your selected rates of return, each year, every year. There WILL be market downturns in the future. This calculator can’t predict them and take them into account. Bear this in mind when inspecting results, as 100% high yield assets will always be the allocation that the calculator will estimate is providing the most savings.
In reality, market fluctuations occur, and most people will want a mix of asset classes to ride out those fluctuations.
Conclusion
The Retirement Savings Calculator spreadsheet allows you to estimate how much you need to save based on factors such as your desired retirement income, CPF Life Retirement Sum, as well as retirement age.
I hope you found this calculator useful. Feedback is definitely welcome! Do share your feedback via the the feedback form! Thank you!